This is a revised copy of my original post in the Tableau Community blogs from 2024.
Back in the day (before 2020.2), you could add worksheets from different data sources to a dashboard, define a filter from one of them, “Apply to selected sheets”, and it would automatically filter the other sheets using blending.
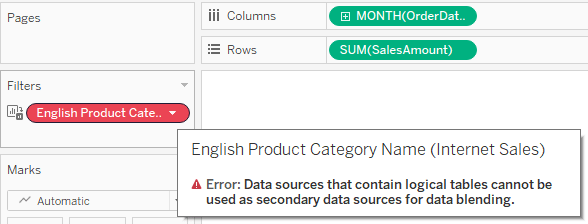
Then came relationships, which enabled us to create more flexible and efficient data sources. However, the filtering option was suddenly lost, because the secondary data source in a blend cannot include a relationship. When you try to apply a filter from one worksheet to another, and both are based on relationships, the second is suddenly disabled (grayed out or empty), and when diving into it you see the dreaded message:
So we started creating workarounds – and especially using parameters as filters, with all their disadvantages: no “All” option, no multi-select, no “relevant values”. And telling customers (or users) that on dashboards using multiple “advanced” data sources their filtering options were limited.
And then, after almost 4 years of dithering around this, I had an epiphany. Looking around a bit (using mostly Google Search, of course) I couldn’t find anyone who had implemented this sort of solution, or at least written about it.
So here are the sample workbook:
https://public.tableau.com/app/profile/dan.chissick/viz/RelationshipFiltering/SalesDashboard
and the explanation:
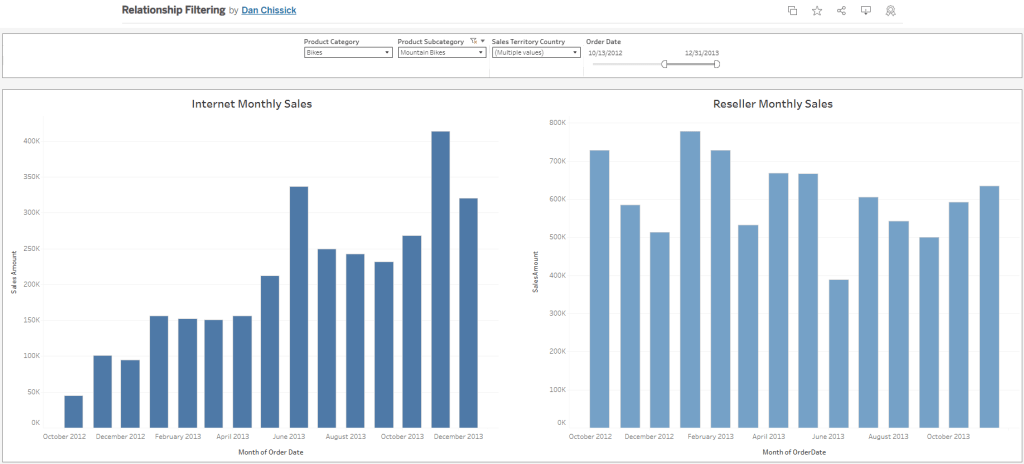
The data is based on the Microsoft AdventureWorksDW database. There are two data sources with relationships to various dimensions: Internet Sales and Reseller Sales. Both have similar data and some common dimensions.
Basically the idea is to create a supporting data source for each dimension used as a filter, with no relationships. Joins are possible, of course – if you want to create a hierarchy, for example.
In this case we have three supporting data sources:
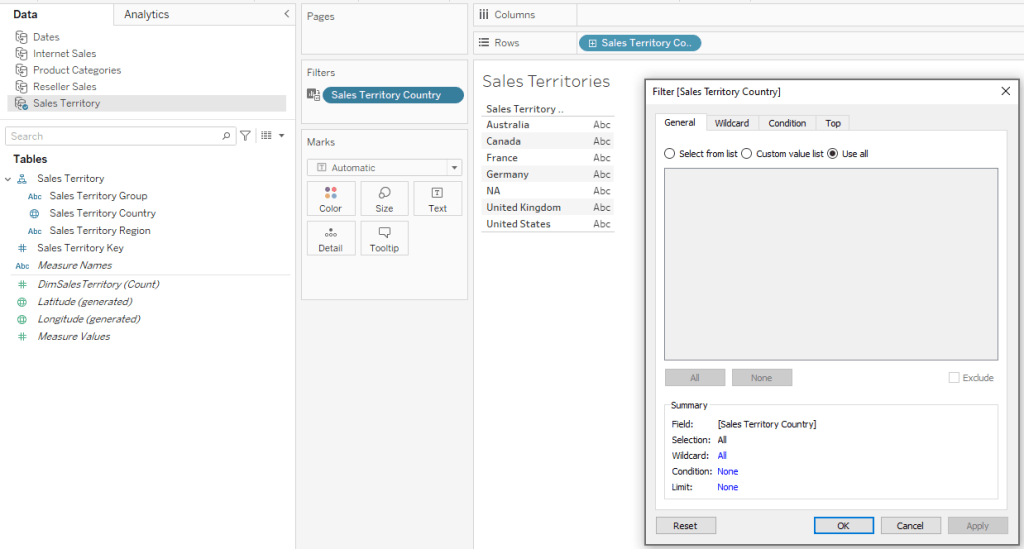
· Sales Territory (including a hierarchy of Group, Country, Region)
· Product Category (including Category and Sub-Category)
· Dates – this actually contains all dates within the relevant data range, and is based on a separate view from the actual data. I named the date field “Order Date” because this is the field’s name in the main data sources.
Now create a dashboard and add worksheets from the two main data sources. I’ve added two bar charts.
For the Sales Territory Country filter (for example), create a worksheet with only Sales Territory Country on the rows. Add the same field as a filter as well (select “Use all” for now).
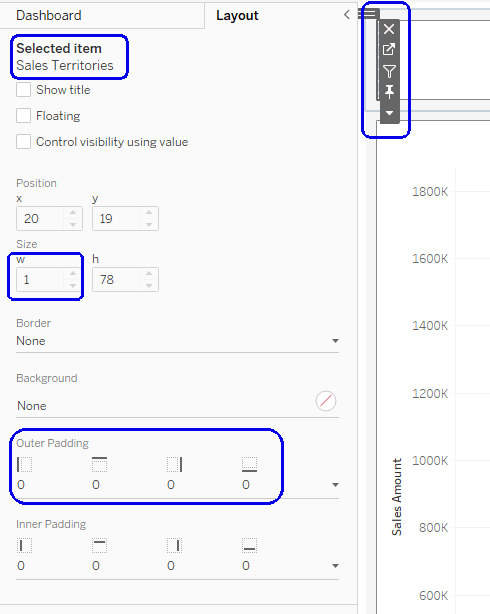
Go to your dashboard, and drag the worksheet onto it. Then make it disappear: set “Outer padding” in the layout to zero, and the height and/or width in pixels to 1.
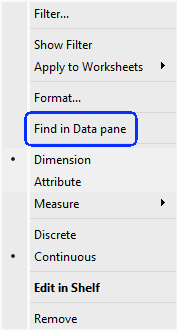
In the worksheet menu select Filters –> Sales Territory Country, and the filter will appear. Place it wherever you want, Apply to Worksheets –> Selected Worksheets, and select the worksheets with the data.

And there it is – the filter affects both bar charts, using the Sales Territory data source, which has no relationships, as the secondary data source for the filter.
Using the Product Category data source and another hidden worksheet, I created a couple of additional filters for Category and Sub-Category.
As for the dates, the process is the same, and I can use any type of date filter – relative, range of dates, year, etc. It’s important for the independent Dates data source to include all possible dates in the actual data sources, so the blending works properly.
To summarize – the finished dashboard has charts from two different data sources with relationships and multiple logical tables, filtered by common dimensions with little effort. The supporting “dimension” data sources can be re-used, so this is a relatively simple workaround for organizations working with many complex data sources and seeking to combine them within multiple dashboards.