I’ve been working as a consultant for a Tableau Partner (and reseller) for over a decade, so I’ve been asked by potential customers many times: Why Tableau? Why should we prefer Tableau over its competitors – Power BI, Qlik, Looker, and various others?
For the customers we have various answers, depending on the context – their requirements, size, deployment type, self-service, embedding, even the community support, and more. But why am I a Tableau “freak”? And so many others in this same community? What makes Tableau special, compared to the other top-end visualization tools?
I’ve been working in data visualization since the nineties, first with Panorama (which, back then, was excellent) and then touching upon various other tools. When I tried out Tableau for the first time (around 2014) it was just a test in my spare time, and nothing happened. But about a year later I got my first project, so I had to dig deeper, and I was hooked.
So what’s the difference? There are two major factors.
First – all the visualization tools I had used before, and most of those I’ve seen since, have a similar method for creating a chart (“worksheet”, “widget”, or whatever): You choose the type of chart from a menu, connect it to your data model, and start setting the properties – which dimension is on rows (or “categories”), what measure to display, bar color, line thickness, label font, and so on. If you need a different type of chart, you get a new set of properties.

Tableau, from the beginning, was different. Every worksheet (for a chart or table) uses the same set of definitions, or cards: Columns, Rows, and Marks. You have several types of marks, but almost all of them have the same sets of properties – Color, Size, Text, Tooltip, Detail (and sometimes Shape, Path and Angle). The “Show Me” pane is just a set of default configurations, not really a chart selector, and I rarely use it.
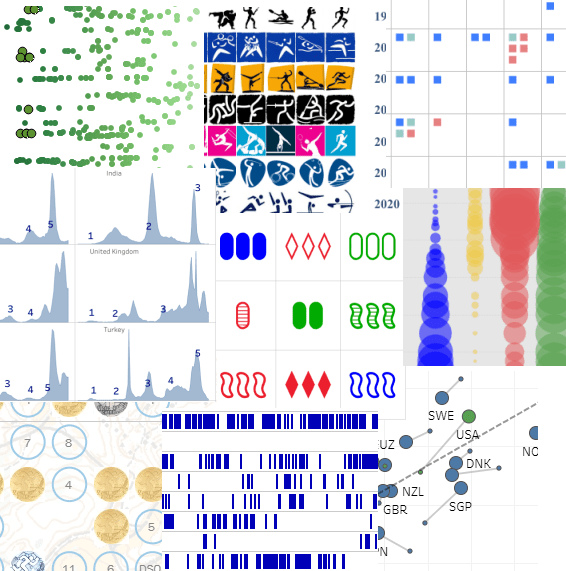
This means that once you understand the interaction between rows, columns and marks, you can create almost anything – and I mean anything, not just data visualizations, but also artwork and games, for example. There’s an inherent flexibility that gives Tableau an advantage over other tools, both in speed of development and in the ability to iterate and “play around”, because you don’t have to select or switch the type of object that you’re working on all the time, and you’re not limited to their predefined attributes.

The second factor is Tableau’s calculations. I agree that all BI tools have the ability to create calculated fields, but Tableau has a great combination of a simple interface – everything is in one place, easily accessed and edited – and a large array of options, from the simplest arithmetic to Level of Detail functions and Table Calculations. Once you gain a basic understanding of how it works – aggregate and row-level, and a few other basics – it’s very easy to use, and also very powerful.

Some people don’t get it. They’ve been using Power BI or another competitor’s software for years, have difficulty switching to a Tableau mindset, and will always prefer their original tool. But I believe that Tableau’s greatest advantage is still the basic development interface, that allows you more flexibility and speed of implementation compared to its competitors.
Of course there are other features. In Desktop – you can create a flexible data model from almost anything, and then manipulate the data in various ways. Dashboard design and actions. Beyond it – Tableau can be used by a lone researcher or by an enterprise with 50,000 users, online or offline. Tableau Public, of course. APIs, embedding, and more. The Community.
But as Andy Kriebel, in my opinion the greatest Tableau guru of all time, recently wrote:
Tableau is not Agentic Analytics
Tableau is not Tableau Next
Tableau is not Tableau Cloud
Tableau is Tableau Desktop
What he meant was that the core of Tableau is still the basic development interface, of which Tableau Desktop is the main component. You can add features around it, but without Desktop it won’t be the same. And Desktop is what makes Tableau the best.

Leave a comment