One of the tools I use a lot in Tableau is Performance Recording, which enables you to see a detailed breakdown of the performance of any dashboard, down to thousands of different actions happening behind the scenes, and detailed timing for all of them.
In this post I’ll focus on how to use the Performance Recording (PR) tools properly, while in a future post I’ll elaborate on what we can learn from the results.
How to start
A Performance Recording can be started on both Tableau Desktop and Server (web), though not on Tableau Cloud.
Desktop
With Tableau Desktop open, go to the menu Help → Settings and Performance → Start Performance Recording. Nothing happens, but the recording has started.
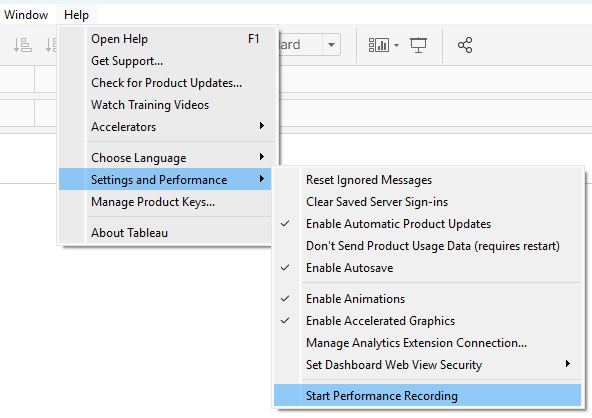
To stop the recording, use the same menu – it now says “Stop Performance Recording”. When you do so, a new Tableau workbook with the results will open after a few seconds. More about that later…
Web
On Tableau Server, you first need to make sure that the PR option is turned on in Server Settings. Then you can record any view by appending “?:record_performance=yes” to the URL. Note that if you have already opened the view, it will already have “?:iid=1” or something similar on the end. You can either replace this, opening a new session, or append and keep the session, like this: “?:iid=1&:record_performance=yes”.
At this point a popup message is displayed, and the recording icon appears in the toolbar. If it doesn’t appear, the PR option is probably disabled.

To get the results, click on the icon, and a window will open with a web version of the PR workbook. My recommendation is to download it immediately in a Tableau workbook format, and then open using Desktop.
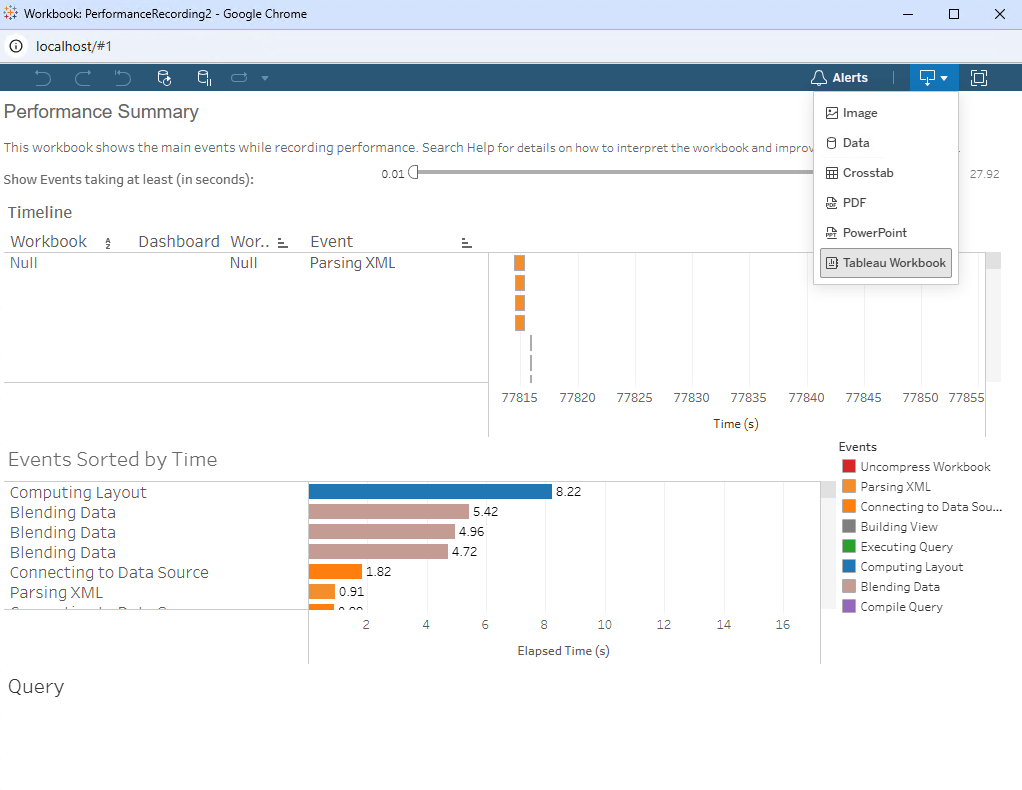
Note that this doesn’t stop the recording. Clicking on the icon later on will download another (larger) workbook. To stop recording, remove the “record_performance=yes” tag from the URL.
As already noted, you can’t perform a PR on Tableau Cloud, but you can on Tableau Desktop that is connected to a published data source on Cloud.
What to measure
OK, so now the PR is running, but how do you measure properly? Here are some tips.
- Make sure the data isn’t being retrieved from cache. If you select a data set that has already been queried (in your Desktop session or on the server), there’s a good chance that the dashboard will load much faster, because it is already cached. To prevent this, I always include switching filters in my scenario, so the data changes and has to be queried again.
- Know what is working slowly, so you can test it. It could be a specific dashboard in a workbook, a drilldown action, or a filter. Make sure you’re testing the right actions.
- If you’re performing several steps, pause between them for 5-10 seconds (at least). This creates a visible gap in the PR timeline, so you can see your steps distinctly.
- Take a note of your actions, so you know which part of the recording is which action. Tableau won’t tell you.
Fixing the results
OK, so now we have a PR workbook, and it doesn’t look good. The template for this workbook hasn’t been updated by Tableau for at least a decade, and has some issues. I always apply a few fixes before analyzing the data:
- Resize both dashboards (“Performance Summary”, “Detailed Views”) to Automatic instead of their default size, which is too small.
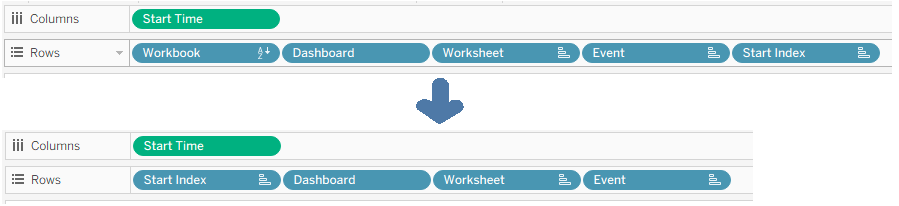
- Open the Timeline worksheet, go to the Rows shelf, and drag the last field (Start Index) onto the first one (Workbook), replacing it. Note that this reorganizes the worksheet.
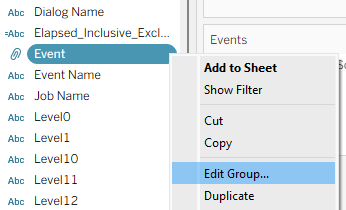
- Now go to the data pane, and edit the “Event” group. There’s a bug (documented here) and some important events haven’t been assigned to the “Executing Query” group, which is very important, so we have to assign them manually. Open the “Others” group, and if you find “qp.run_query” or “Executing Queries” there, assign them to the “Executing Query” group, and click OK.
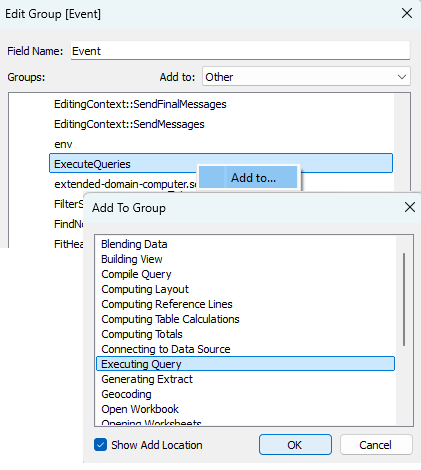
- Finally, open the Query worksheet and edit the text – I recommend decreasing the font size to 9 points and aligning to top left, but this is less important than the other modifications.
There’s also a bug in several minor versions that causes the PR workbook to open with the default dataset, and not your actual recorded data, but that has been fixed: https://help.salesforce.com/s/issue?id=a02Ka00000mQybrIAC
On Desktop, the PR dashboard template can actually be hacked – you can replace it with your own layout and style by switching the workbook, but there’s a procedure to be followed:
- Prepare your dashboard design(s) in a workbook based on any performance recording that you’be made.
- Open the existing PR template: C:\Program Files\Tableau\Tableau <version>\Performance\PerformanceRecordingv101.twbx
- Copy a worksheet from the template to your new file. This will copy over the template data source as well, which is what we really need.
- Use Replace Data Source to switch the workbook from your data source to the copied one.
- Close your original data source.
- Rename the remaining data source to “Timeline”.
- Delete the worksheet that you copied over, and save the workbook.
- Replace the original workbook in the Performance folder with yours – rename it to “PerformanceRecordingv101 old.twbx” and then rename your workbook to “PerformanceRecordingv101.twbx”.
The next time you perform a PR on this version of Tableau Desktop, the result should appear with the new layout.
I’ve tried to find a similar hack for Tableau Server, but without success. Apparently the template is within the internal database and inaccessible, but I’m sure someone will soon have an AI agent that modifies the resulting PR workbook at the click of a button, instead of repeating several steps each time.
Problems
There are still a couple of issues with the results of a PR, even if formatted beautifully and performed well. Tableau haven’t updated the functionality for years, and some gaps have grown bigger and bigger:
- Most events recorded don’t include the name of the relevant worksheet, or even the dashboard. This is a limitation especially when you are looking for a specific bottleneck, because you won’t know which worksheet is responsible for a slow query .
- Some “Executing query” data displays the actual query string, but for multi-fact data sources there is nothing. The best query results can be achieved with Tableau Desktop and embedded (not published) data sources, but that setup usually doesn’t reflect the actual user environment.
Summary
Tableau Performance Recordings aren’t perfect, but are still a useful tool for analyzing tricky performance issues. In a future post I’ll show how to read a PR workbook and understand what it’s telling you.
 BI Stories
Leave a comment